
Navigating the complex world of foreign exchange (Forex) trading can be daunting for both newcomers and experienced traders alike. A fundamental tool in a trader’s arsenal is the ability to read and understand forex charts. These charts are not mere lines and colors but the very language of the currency market. Grasping their meaning empowers traders to make informed decisions, anticipate market movements, and manage risk effectively.
Decoding the Basics: What are Forex Charts?
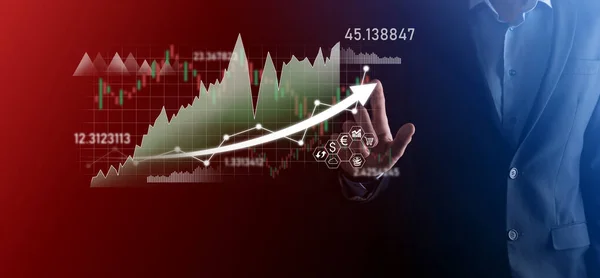
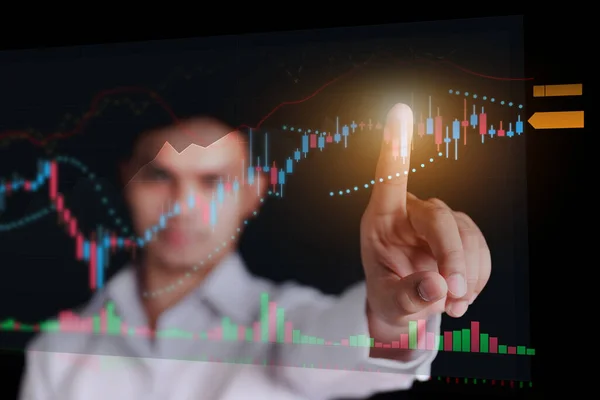
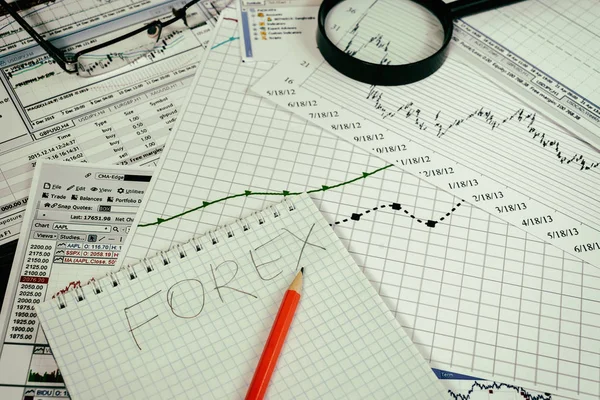
Forex charts are a visual representation of the exchange rates between currencies over specific time periods. They help traders identify trends, patterns, and potential points of entry and exit. Each point on a chart represents the exchange rate at a particular moment, painting a picture of how a currency pair’s value has fluctified over time. Understanding these charts is foundational for any successful trading strategy in the Forex market.
Forex charts come in various formats, each providing different insights. For instance, a simple line chart connects the closing prices over a set period, offering a clear view of overall direction but lacking detail. More sophisticated charts like bar or candlestick charts provide deeper insights into opening and closing prices, as well as highs and lows within the specified timeframe. These charts are indispensable for traders looking to make nuanced decisions based on comprehensive data.
Navigating Chart Types: From Lines to Candles

Chart Comparison Table
| Chart Type | Description | Key Features |
|---|---|---|
| Line Chart | Connects closing prices over a time period. | Simplicity; good for identifying overall trends. |
| Bar Chart | Displays the opening, closing, high, and low prices for each period. | More detailed; shows market volatility. |
| Candlestick Chart | Similar to bar charts but uses a “body” to depict the open and close, and “wicks” to show highs and lows. | Highly detailed; visually represents market sentiment. |
The choice of chart depends on the trader’s strategy and the specific information they wish to extract. For instance, a swing trader might prefer candlestick charts for their detailed information on market sentiment and potential reversals, while a long-term investor might find line charts sufficient for spotting general trends.
Spotting Patterns: The Key to Predicting Moves
Forex trading isn’t just about reacting to what’s already happened; it’s about anticipating future movements. Recognizing chart patterns is central to this predictive approach. Patterns like ‘head and shoulders’, ‘double tops’, and ‘flags’ can signal upcoming market movements. Traders who master the art of pattern recognition can position themselves to capitalize on potential market shifts ahead of the crowd.
Patterns are categorized into continuation and reversal patterns. Continuation patterns suggest that an existing trend will persist, while reversal patterns signal a potential change in direction. Mastery of these patterns allows traders to refine their strategies, entering and exiting positions at the most opportune moments based on anticipated market movements.
Breakouts and Reversals: Timing Your Trades

Timing is everything in Forex trading. Breakouts and reversals are critical concepts that can help traders decide when to make their moves. A breakout occurs when the price moves outside a defined boundary, such as past a resistance or support level. This often signals the start of a new trend. Conversely, a reversal indicates a change in the direction of an existing trend, often identified through patterns like ‘head and shoulders’ or ‘double tops’.
Traders must exercise caution, however, as false breakouts and reversals can lead to losses. Combining pattern recognition with other analytical tools, such as indicators or fundamental analysis, enhances the accuracy of these predictions. Timing trades based on a comprehensive analysis allows traders to navigate the Forex market more confidently and profitably.
Common Pitfalls in Chart Analysis to Avoid
Even with a solid understanding of Forex charts, traders can fall into common traps. Over-reliance on patterns without confirmation from additional analysis is one such pitfall. Markets are influenced by a myriad of factors, and patterns do not always play out as expected. Another error is analysis paralysis, where traders get bogged down in so much data that making decisions becomes overwhelming. Succumbing to emotions, such as clinging to a losing position in hopes of a reversal, is another common mistake that can erode profits.
To navigate these pitfalls, traders should adopt a disciplined approach, combining chart analysis with a well-considered trading plan and risk management strategy. Continual learning and adaptation to the evolving market are also crucial for long-term success in Forex trading.
Advancing Skills: Utilizing Chart Patterns
For traders looking to advance their skills, delving deeper into chart patterns and analysis techniques is a logical next step. This involves not only recognizing patterns but also understanding the underlying market psychology that creates them. Advanced traders learn to discern the strength of a pattern, evaluate the probability of different outcomes, and integrate sophisticated analytical tools into their trading strategies.
Education is a continuous journey in the world of Forex trading. The most successful traders are those who remain curious, adaptable, and disciplined, always seeking to refine their understanding of the market and its many nuances. By mastering Forex charts and patterns, traders equip themselves with the knowledge to navigate the market’s complexities with confidence and skill.


Spotting patterns like head and shoulders can help predict market moves. This is new for me.
Understanding different chart types can improve trading strategies. Bar charts show market volatility.
Forex charts are so important for trading! They show how currency values change over time.
Breakouts signal new trends, while reversals show trend changes. Timing is key in Forex trading.
Traders need to avoid analysis paralysis and stick to a disciplined trading plan.
It’s risky to rely only on patterns without other analysis. Markets are influenced by many factors.
I learned that candlestick charts give detailed info about open and close prices. Very helpful!
Line charts are simple and good for general trends; candlestick charts show detailed market sentiment.